Interpret tally charts
Key Notes:
📊 What is a Tally Chart?
- A tally chart is a way to count and record data.
- It uses tally marks (lines) instead of numbers.
- Each line represents one item.
✏️ Tally Marks Rules
- One line = 1
- Four lines = 4
- The 5th line crosses the first four → makes a group of 5
- This helps us count faster
👉 Example:
|||| = 4
||||̶ = 5
🔍 How to Interpret a Tally Chart
Look at each category (like fruits, animals, colors)
Count the tally marks
Convert tally marks into numbers
Compare which has:
- More
- Less
- Equal
📘 Example
| Fruit 🍎 | Tally Marks | Number |
|---|---|---|
| Apple | ||
| Banana | ||
| Mango |
👉 Questions students can answer:
- Which fruit has the most? → Apple
- Which has the least? → Mango
- How many bananas? → 5
💡 Important Skills
- Counting in groups of 5
- Careful observation
- Comparing numbers (more/less)
- Reading simple data
🎯 Teaching Tips
Use real objects (sticks, pencils)
Let students draw tally marks
Ask simple questions like:
- “How many altogether?”
- “Which is more?”
🎉 Fun Activity Idea
- Ask students to survey:
“What is your favorite fruit?” 🍌🍎🥭 - Make a tally chart together and interpret the results
learn with an example
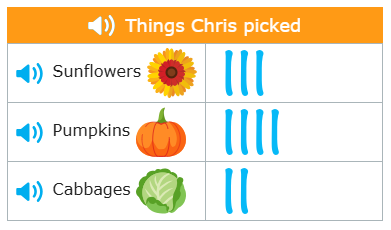
Chris picked some things in the garden. This tally chart shows how many of each type of thing he picked.
How many things did Chris pick in all?
____________ things
Count the tally marks for each type of thing Chris picked.
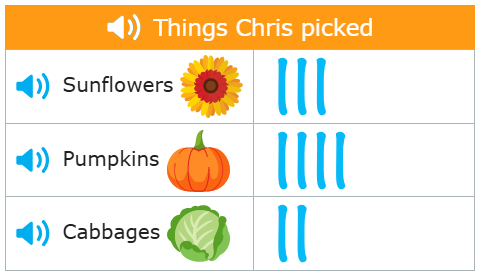
Chris picked these things:
- 3 sunflowers
- 4 pumpkins
- 2 cabbages
Add to find the total number of things.
3 + 4 + 2 = 9
Chris picked 9 things in all.
Gail went to the park with her friends. They ate some snacks. This tally chart shows how many of each type of snack they ate.
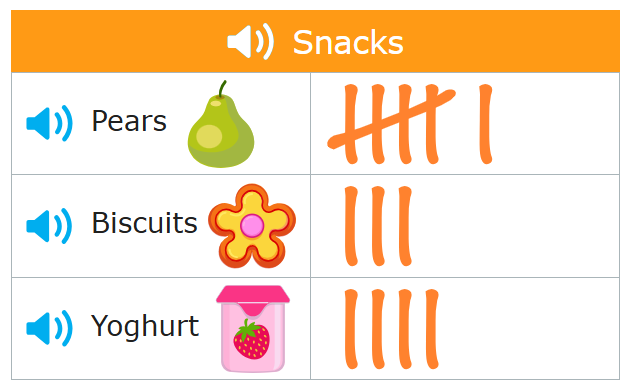
How many more pears than biscuits did they eat?
Count the tally marks for pears and biscuits.
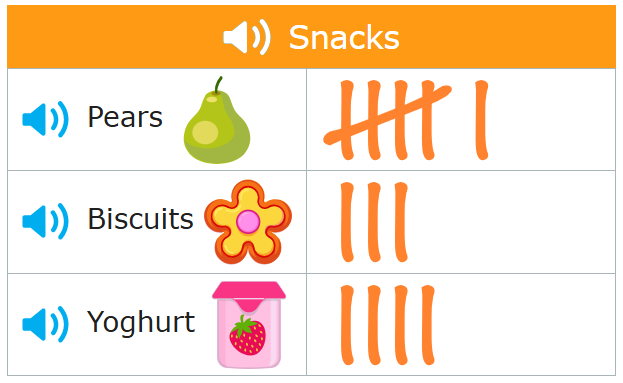
Gail and her friends ate these snacks:
- 6 pears
- 3 biscuits
Subtract to find the difference.
6 – 3 = 3
They ate 3 more pears than biscuits.
Daisy and Leo had a picnic. They put some food in their basket. This tally chart shows how many of each type of food they packed.
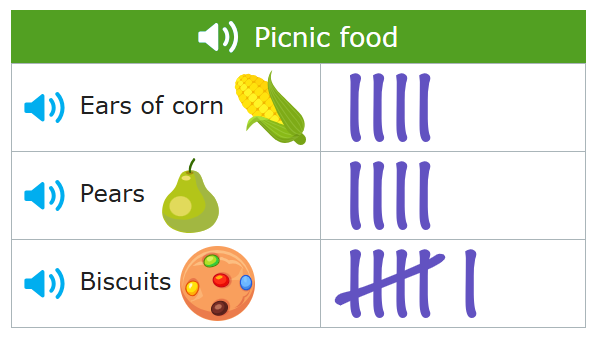
How many more biscuits than pears did they pack?
Count the tally marks for pears and biscuits.
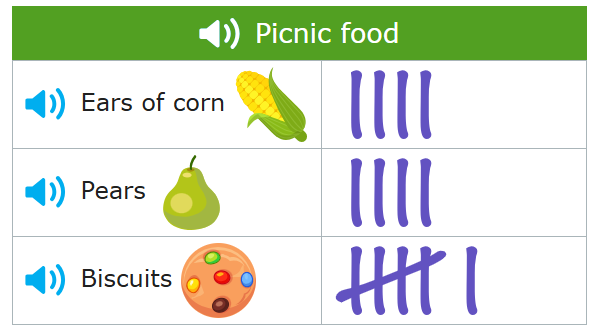
They packed this picnic food:
- 4 pears
- 6 biscuits
Subtract to find the difference.
6 – 4 = 2
They packed 2 more biscuits than pears.
let’s practice! 🖊️